Observability: Monte Carlo Data
As of 2026-10-06
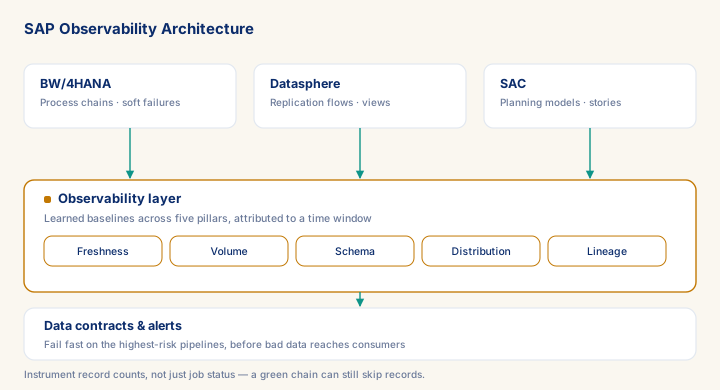
SAP landscapes fail silently: a green BW/4HANA process chain can still skip 40% of records, and a single Datasphere schema change can break a SAC story overnight with no error anywhere in the chain. Monte Carlo Data is the market-leading platform for catching this across five pillars — freshness, volume, schema, distribution, lineage — but the decision a consultant actually faces is build-vs-buy and which pillar to instrument first, not which vendor menu to click through. Financial-services clients under DORA and BCBS 239, and healthcare/pharma clients under MDR and GxP, now treat this lineage-and-quality evidence as an audit requirement, which is what moves the engagement from a standard implementation rate to a senior-principal rate. Expect a 4-8 week first engagement to stand up one observability domain, followed by a tuning retainer.
What you will learn
- Design a cross-system data observability architecture spanning BW/4HANA, Datasphere, and SAC using freshness, volume, schema, distribution, and lineage pillars — and evaluate where Monte Carlo's connectors integrate versus where custom instrumentation is required.
- Implement volume and freshness monitoring for BW/4HANA process chains and Datasphere replication flows, distinguishing job-status monitoring from true data-quality instrumentation including record-count validation.
- Construct data contracts in SAP Datasphere using YAML-based specifications and scheduled validation tasks to enforce schema, volume, and freshness SLAs before anomalous data reaches downstream SAC consumers.
- Identify and remediate the five most common silent failure modes in SAP analytics pipelines — including soft chain failures, cross-system schema drift, distribution shift post-migration, and absent lineage at system boundaries.
Why SAP Landscapes Break Silent: The Observability Problem
SAP analytics environments generate data failures that are invisible until a business decision is already compromised. A Datasphere view returns stale figures because an upstream BW/4HANA extraction job failed at 03:00 without alerting anyone. A SAC planning model feeds on a distribution that shifted two standard deviations last week when a source system migration pushed through a field mapping change. Nobody noticed because no pipeline failed — the data just changed shape quietly.
Data observability is the discipline of instrumenting your data estate with the same rigour you would instrument a production application: continuous measurement of freshness, volume, schema stability, distribution drift, and lineage completeness. Monte Carlo Data is the market-leading commercial platform in this category, offering ML-based anomaly detection across these five dimensions. But understanding Monte Carlo's capabilities matters less than understanding the underlying observability model it implements, because the concepts translate to every tool — including those you build yourself on top of SAP Data Intelligence or Datasphere's own monitoring APIs.
Prerequisites
- Intermediate hands-on experience on SAP analytics projects
- Familiarity with SAP Datasphere catalog/replication flows and BW/4HANA process chains
Outcomes
- Work through a realistic scenario: A European reinsurer's finance function is under DORA scrutiny: risk calculations flow from BW/4HANA through a Datasphere semantic layer into SAC planning models.
- Recognize and avoid the anti-pattern: Instrumenting job status instead of data quality — A BW process chain or Datasphere replication task reports 'green' while 40% of records are silently skipped.
- Apply the module's core decision: Buy Monte Carlo (or equivalent) vs.
- Track mastery with the KPI: Freshness SLA hit rate (target: >= 98% of monitored tables land within their expected window; red flag: < 90% on tables feeding executive or regulatory reporting).
Full module available to members. The full module adds: the decision framework · the end-to-end scenario walkthrough · the KPI scorecard · the anti-patterns · the code blocks · the knowledge check · the diagrams.