SAC Stories & Dashboards
As of 2026-10-04
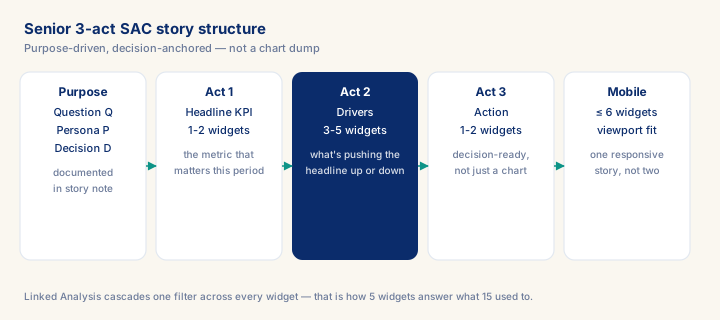
Stories = decision-driven consumption layer. Senior 3-act structure: Headline KPI · Drivers · Action. ≤ 7 widgets per page (47 = 47 AM queries). Use Optimized Design (modern + mobile); Classic only for legacy until migration. Mobile-first or ship dies in 3 months. Every story has documented purpose: 'answers Q for persona P at decision D'.
What you will learn
- Work through a realistic scenario: Industrial group, finance team wants 'monthly business review' story. 4-week build.
- Recognize and avoid the anti-pattern: 47 widgets on one page — Perf collapse + cognitive overload.
- Apply the module's core decision: Story type — choose Optimized Design for new; Analytic Application if custom scripting needed, not Classic Design for new builds.
- Track mastery with the KPI: Widget count per page (target: ≤ 7; red flag: > 12 = redesign).
Module overview
SAP Analytics Cloud Stories = the consumption surface where governed Datasphere data becomes business decisions. A senior consultant designs stories around the decision the user is making, not the data the team has. Junior failure: 47 charts on one page. Senior craft: 3-7 charts per page, each answering one question, with a clear narrative arc.
The 3-act structure every senior story follows:
- Headline KPI (1-2 widgets) — the metric that matters this period.
- Drivers (3-5 widgets) — what's pushing the headline up or down.
- Action (1-2 widgets) — what should the user do next.
Story types and when to use each.
- Optimized Design Experience — modern, mobile-friendly, recommended for new builds.
- Classic Design Experience — legacy, only for existing stories until migration window.
- Analytic Application — when scripting + custom interactivity are needed (M023).
Performance reality. Story performance is dominated by (a) underlying analytic model query cost and (b) widget count + data volume per widget. A 47-widget story queries the AM 47 times. Senior pattern: ≤ 7 widgets per page, hierarchy + filter linkage to limit widget cardinality, server-side aggregation pushed to DSP analytic model.
Prerequisites
- Review core concepts first: C018, C019, C021
Outcomes
- Work through a realistic scenario: Industrial group, finance team wants 'monthly business review' story. 4-week build.
- Recognize and avoid the anti-pattern: 47 widgets on one page — Perf collapse + cognitive overload.
- Apply the module's core decision: Story type — choose Optimized Design for new; Analytic Application if custom scripting needed, not Classic Design for new builds.
- Track mastery with the KPI: Widget count per page (target: ≤ 7; red flag: > 12 = redesign).
Guides that answer with this page
These guides cite this page as one of the sources their answer rests on.