Tables, Views & Data Builder
As of 2026-10-04
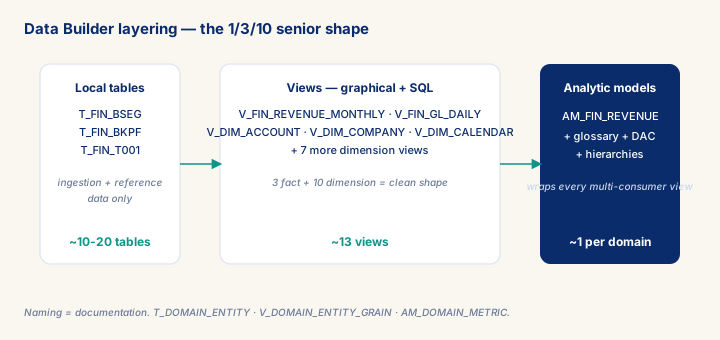
The Data Builder houses 80 % of CU cost. Senior pattern: 1/3/10 rule (1 analytic model · 3 fact views · 10 dimension views), strict naming (T_/V_/AM_ prefix per domain), graphical views for standard work, SQL views for performance-critical. Cast types once, project explicitly, partition tables > 50M rows. The lineage graph is the second deliverable after the ADR.
What you will learn
- Choose between local tables, graphical views, and SQL views using persistence, complexity, and performance criteria — not habit
- Apply the 1/3/10 rule and T_/V_/AM_ naming convention to refactor an ad-hoc domain space into an auditable shape
- Diagnose the top CU-cost anti-patterns (self-joins, re-casting, SELECT *, missing partitions, over-federation) before a client's cost review, not after
- Translate a modeling recommendation into day-rate-relevant language a sponsor can repeat
Module overview
The Data Builder is where Datasphere modeling actually happens, and it is where the large majority of a tenant's ongoing capacity-unit cost gets decided, months before anyone sees a bill. Capacity units are consumed by query execution, data movement, and processing load, which means every modeling choice made inside the Data Builder — how many views sit between source and consumer, whether a join is federated live or materialized once, whether a calculation runs once and gets reused or gets recomputed by every downstream consumer — is a cost decision as much as a design decision. Senior craft in this module is not "build more views faster"; it is "build fewer views, with cleaner contracts, that still make sense and still perform when a CFO asks for a cost review at month six."
Prerequisites
- Review core concepts first: C008, C004, C032
Outcomes
- Distinguish local tables, graphical views, and SQL views by persistence, complexity, and performance profile.
- Refactor a 47-view sprawl into the 1/3/10 shape with T_/V_/AM_ naming applied.
- Explain the architecture and decision points for Tables, Views & Data Builder to a non-technical sponsor in two minutes.
- Produce a repeatable ADR + model validation pack usable on a different client domain.
Full module available to members. The full module adds: the decision framework · the end-to-end scenario walkthrough · the KPI scorecard · the anti-patterns · the code blocks · the knowledge check · the diagrams.