SAC Performance Tuning
As of 2026-10-04
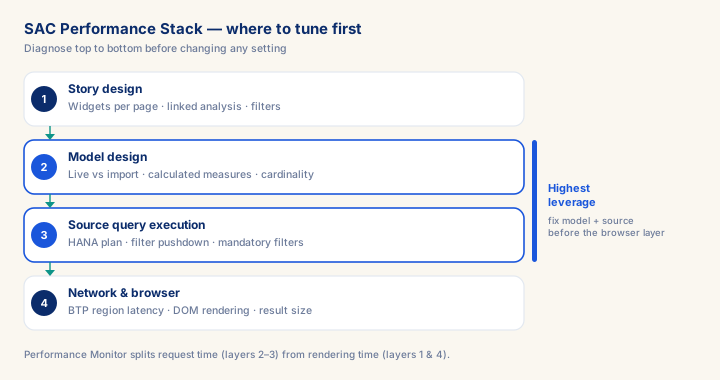
SAC performance problems are rarely SAC problems — they live in model design, source query execution, or story design. Diagnose with the built-in Performance Monitor (request time vs rendering time) and the browser Network tab. Live vs import is the fundamental trade-off: live has no row limits but is capped by source query speed; import is fast but capped at 2M/10M rows and refresh latency. Highest-leverage fixes: push calculated/restricted measures to the Datasphere analytic model, mitigate exception-aggregation cost, cap dimension cardinality, limit widgets per page (8-10 for live), replace linked analysis with page-level filters, and verify filter pushdown via HANA execution plans. Workflow: measure, change, measure — never tune on anecdote.
What you will learn
- Diagnose SAC story performance using the four-layer stack (story design, model design, source query execution, network/browser) and the built-in Performance Monitor to separate request time from rendering time.
- Decide between live and import model architecture based on data volume, freshness requirements, and source system query capacity, and explain the performance trade-offs of each.
- Apply model-level tuning: push calculated and restricted measures down to the Datasphere analytic model / HANA layer, and mitigate the cost of exception aggregation and high-cardinality dimensions.
- Optimize story design (widget count per page, linked analysis vs page-level filters, table pagination) and verify filter pushdown to the source using HANA execution plans and mandatory filters.
Diagnosing and Tuning SAP Analytics Cloud Performance
SAP Analytics Cloud story and dashboard performance is rarely an SAC problem — it is almost always a model or source problem that surfaces in the client interface. Experienced SAC architects do not look at a slow dashboard and reach for SAC settings first; they work down the performance stack systematically, because the fix is almost always either (a) in the model design, (b) in the source query, or (c) in how the story design is asking the model for data. Understanding this stack is the foundation of every effective tuning engagement.
Prerequisites
- Intermediate hands-on experience on SAP analytics projects
- Review core concepts first: C008, C019, C020
Outcomes
- Diagnose SAC story performance using the four-layer stack and the built-in Performance Monitor to separate request time from rendering time.
- Decide between live and import model architecture based on data volume, freshness requirements, and source system query capacity.
- Apply the module's core decision: Live model vs import model — choose Import when volumes fit the row limit after pre-aggregation at source and near-real-time is not required — you get a predictable.
- Track mastery with the KPI: Widget request time (target: >= 20% reduction after each source-layer fix; red flag: Less than 20% improvement — the fix likely addressed the wrong layer of the stack).
Full module available to members. The full module adds: the decision framework · the end-to-end scenario walkthrough · the KPI scorecard · the anti-patterns · the code blocks · the knowledge check · the diagrams.
Guides that answer with this page
These guides cite this page as one of the sources their answer rests on.