BDC Monitoring & Observability
As of 2026-10-04
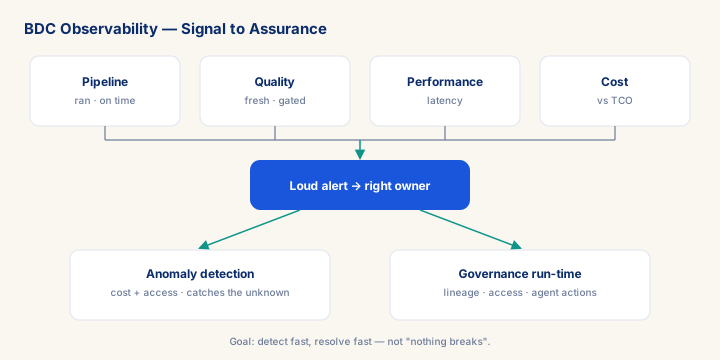
Monitoring tells you if known signals are in bounds; observability lets you ask new questions when something unexpected happens — a BDC platform needs both, or the first sign of trouble is a user complaint or a surprise bill. Four signal domains: pipeline health (ran/succeeded/on-time), data quality+freshness (stale/broken numbers), performance (latency), consumption/cost (vs TCO, M032/M043) — each with its own threshold + owner; watching only "did the job run" misses three-quarters. Fail loud, not silent (M042) — silent failure lets bad data reach a decision; alerts must reach the right owner, not a dead inbox. Observability is the run-time assurance layer for design-time governance: lineage (M077) says where a number came from, observability says when it went stale; access (M081) defines who may act, observability detects the anomaly; agentic AI (M049) needs action auditability. Combine static thresholds (known) + anomaly detection (unknown, feeds cost M043 + security M090). Honest: reduces time-to-detect/resolve, doesn't prevent every incident.
What you will learn
- Map BDC health across all four signal domains — pipeline, data quality/freshness, performance, cost — not just job-status
- Design alerting that fails loud, reaches the right owner, and combines static thresholds with anomaly detection
- Recognize the anti-patterns — silent failure, dead-inbox alerts, thresholds-only — that turn observability into a dashboard nobody trusts
- Position observability ownership in your personal brand and rate conversation
Module overview
Monitoring and observability are how you know the SAP Business Data Cloud (BDC) platform is actually healthy — not just running. The distinction is the whole discipline in miniature. Monitoring tells you whether known signals stay within known bounds: is the nightly replication flow green, is the story loading in under three seconds, is capacity unit consumption under the monthly ceiling. Observability answers a different, harder question: when something you never anticipated goes wrong, can you reconstruct what happened and why, using the data the platform already exposes, without having to add new instrumentation after the fact. A platform that only monitors is deaf to the failure mode nobody wrote a rule for. A platform that is genuinely observable turns "why did this story slow down today?" from a multi-day investigation into a fifteen-minute query against existing logs and metrics.
Prerequisites
- Intermediate hands-on experience on SAP analytics projects
- Review core concepts first: C015, C012, C010
Outcomes
- Distinguish monitoring (known signals in bounds) from observability (answering the unexpected) and design a BDC setup that does both.
- Apply the four-domain model — pipeline, quality/freshness, performance, cost — to a live BDC platform.
- Apply the module's core decision: Monitoring scope — choose All 4 domains (pipeline/quality/perf/cost) each owned, not Watching only 'did the job run'.
- Track mastery with the KPI: Signal coverage (target: All 4 domains monitored + owned; red flag: Only pipeline-status watched).
Full module available to members. The full module adds: the decision framework · the end-to-end scenario walkthrough · the KPI scorecard · the anti-patterns · the code blocks · the knowledge check · the diagrams.