SQL Performance for SAP Analytics
As of 2026-10-03
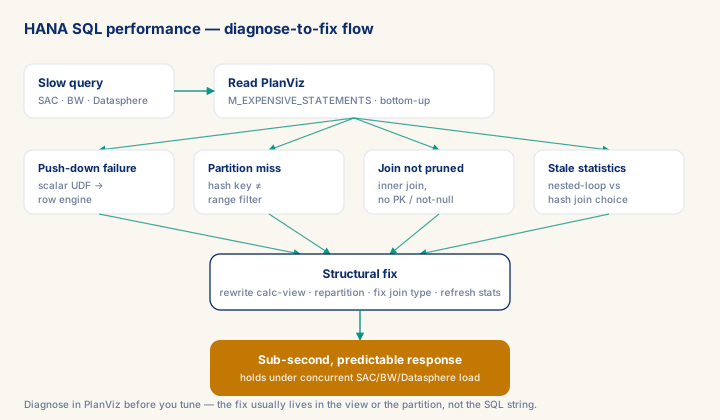
A calculation view that runs in 120 ms in development can take 45 seconds in production once a scalar UDF, an unpruned join, or a badly partitioned fact table pushes HANA out of its columnar fast path — and the fix is almost never a SQL rewrite, it is a structural one. This module teaches you to read a PlanViz output, isolate whether the slowdown is a push-down failure, a partitioning mismatch, a missed join prune, or stale optimizer statistics, and prescribe the calculation-view or partitioning change that removes it for good. Consultants who can do this on a live production HANA system — not just tune a SQL string — are the ones clients retain for performance remediation work billed at €1,200–1,800/day, well past the original migration scope.
What you will learn
- Diagnose push-down failures in HANA calculation views using PlanViz and M_EXPENSIVE_STATEMENTS, and prescribe structural fixes that keep aggregation and filtering in the columnar engine
- Design HANA table partitioning strategies (range, hash, range-hash sub-partitioning) matched to BW/4HANA and Datasphere query patterns, including delta merge tuning for real-time InfoProvider scenarios
- Apply join pruning conditions — join type, uniqueness constraints, cardinality annotations — in both graphical calculation views and Datasphere Analytic Models to eliminate unnecessary dimension joins at runtime
- Maintain the HANA cost-based optimizer through column statistics refresh discipline, and identify memory-pressure-driven performance degradation patterns distinct from plan-quality issues
Why SQL Performance Matters Differently in SAP Analytics
SAP analytics workloads sit at an unusual intersection: columnar in-memory engines, semantic layer abstractions, and mixed OLTP/OLAP traffic that shifts throughout the day. A query that runs in 120 ms on an isolated development tenant can take 45 seconds when SAP HANA is under concurrent load from SAC dashboards, BW/4HANA InfoProviders, and Datasphere replication flows all hitting the same tables. The difference is rarely the query itself — it is almost always push-down failures, missing partition pruning, or unmaterialised calculation view layers that force row-by-row evaluation.
This module teaches you to diagnose and fix those problems at the level of the HANA SQL engine, not at the level of SAP documentation abstractions.
Prerequisites
- Intermediate hands-on experience on SAP analytics projects
- Review core concepts first: C040, C004, C087
Outcomes
- Work through a realistic scenario: A European insurer's BW/4HANA migration went live on schedule, but the daily S&OP dashboard in SAC now takes 45 seconds to refresh instead of the 5 seconds promised in UAT.
- Recognize and avoid the anti-pattern: Tuning the wrong layer — Weeks spent optimising a BW query in SAP GUI while the real bottleneck is a scripted join three levels down in a calculation view.
- Apply the module's core decision: Where to look first when a query is slow — choose Instrument HANA first — PlanViz plus M_EXPENSIVE_STATEMENTS — before touching the BW query or SAC model.
- Track mastery with the KPI: Query response time under load (target: Match or beat the UAT baseline under representative concurrent production load; red flag: The fix is only ever validated on an idle).
Full module available to members. The full module adds: the decision framework · the end-to-end scenario walkthrough · the KPI scorecard · the anti-patterns · the code blocks · the knowledge check · the diagrams.