GreenOps & Sustainable Analytics
As of 2026-10-03
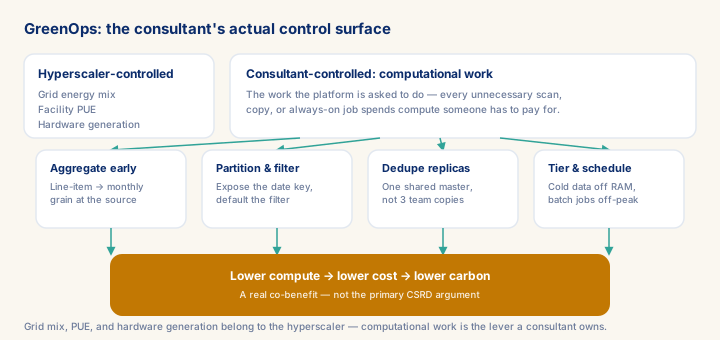
GreenOps forces an honest scope call: a consultant cannot change a hyperscaler's grid mix, PUE, or hardware generation, but can control the computational work the platform is asked to do — and that work is where the money and the carbon both leak. Datasphere landscapes routinely burn 40-60% of production compute on dev/test environments left running around the clock, and tiering cold HANA Cloud data to object storage cuts energy per gigabyte-year by roughly 10-100x while also cutting the bill. CSRD makes this measurable from FY2024 for large EU companies, but the data centre is typically under 0.5% of a large company's emissions by weight — a consultant who sells platform sustainability as the CSRD answer will not survive the client's finance team. As of 2025-2026 this is not a separate rate line; it is a credibility multiplier inside a senior architecture or migration mandate, and one of the few technical arguments that gets ahead of regulation instead of reacting to it.
What you will learn
- Accurately scope what a data platform consultant can and cannot influence in terms of carbon footprint, and explain the dominant drivers (data centre PUE, grid intensity, hardware generation) to client stakeholders
- Apply data minimisation, aggregation-pushdown, partitioning, and tiering techniques in Datasphere and HANA Cloud architectures to measurably reduce compute and storage consumption
- Distinguish SAP Sustainability Footprint Management (business emissions reporting) from analytics platform sustainability, and explain each clearly to business and IT audiences
- Assess the sustainability claims of a cloud migration proposal by checking BTP region grid carbon intensity and comparing against the client's current data centre, using hyperscaler carbon calculator tools
What a Data Consultant Can and Cannot Control
Start with honesty about scope. The sustainability of a data platform is determined overwhelmingly by three factors: the energy mix of the data centre running the workload, the hardware generation of the servers, and the Power Usage Effectiveness (PUE) of the facility. A SAP analytics consultant controls none of these directly. The hyperscaler or colocation provider controls them. What a consultant can control is the computational work that the platform is asked to do — and reducing unnecessary computational work is the practical lever available in every project.
This is not a minor lever. Inefficient data modelling, unnecessary full-table scans, redundant data copies, and always-on workloads that serve nobody overnight account for a substantial share of platform compute. A Datasphere environment where three teams each maintain their own copy of the same customer master because nobody established a shared semantic layer is doing three times the replication, three times the query processing, and three times the storage I/O for the same business information. That is a modelling problem with a sustainability dimension, not the other way around.
Prerequisites
- Review core concepts first: C100, C087, C083
Outcomes
- Work through a realistic scenario: A EUR 1.2bn EU industrial manufacturer is a CSRD mid-cap (first report due FY2025) and mid-way through a Datasphere migration.
- Recognize and avoid the anti-pattern: Conflating SAP Sustainability Footprint Management with platform sustainability — The client believes implementing SFM made the Datasphere/BTP environment greener.
- Apply the module's core decision: Where to position GreenOps in a Datasphere or BW/4HANA mandate — choose Fold it into the architecture review as an operational-excellence lever with a real carbon co-benefit.
- Track mastery with the KPI: Dev/test share of total landscape compute (target: <= 25% of rolling 30-day compute-hours; red flag: > 40% means non-prod is sized like production and left running around the clock).
Full module available to members. The full module adds: the decision framework · the end-to-end scenario walkthrough · the KPI scorecard · the anti-patterns · the code blocks · the knowledge check · the diagrams.